Expenses Dashboard
Manage your expenses with key indicators and budget overview.
Introduction
The expense dashboard provides a centralized view of all the institution's financial activities. It allows managers to track committed expenses, budget consumption by category and department, as well as pending validations and payments.
Good to know
The dashboard updates in real-time and displays data for the current academic year. Indicators can be filtered by period, expense category, or department.
Overview
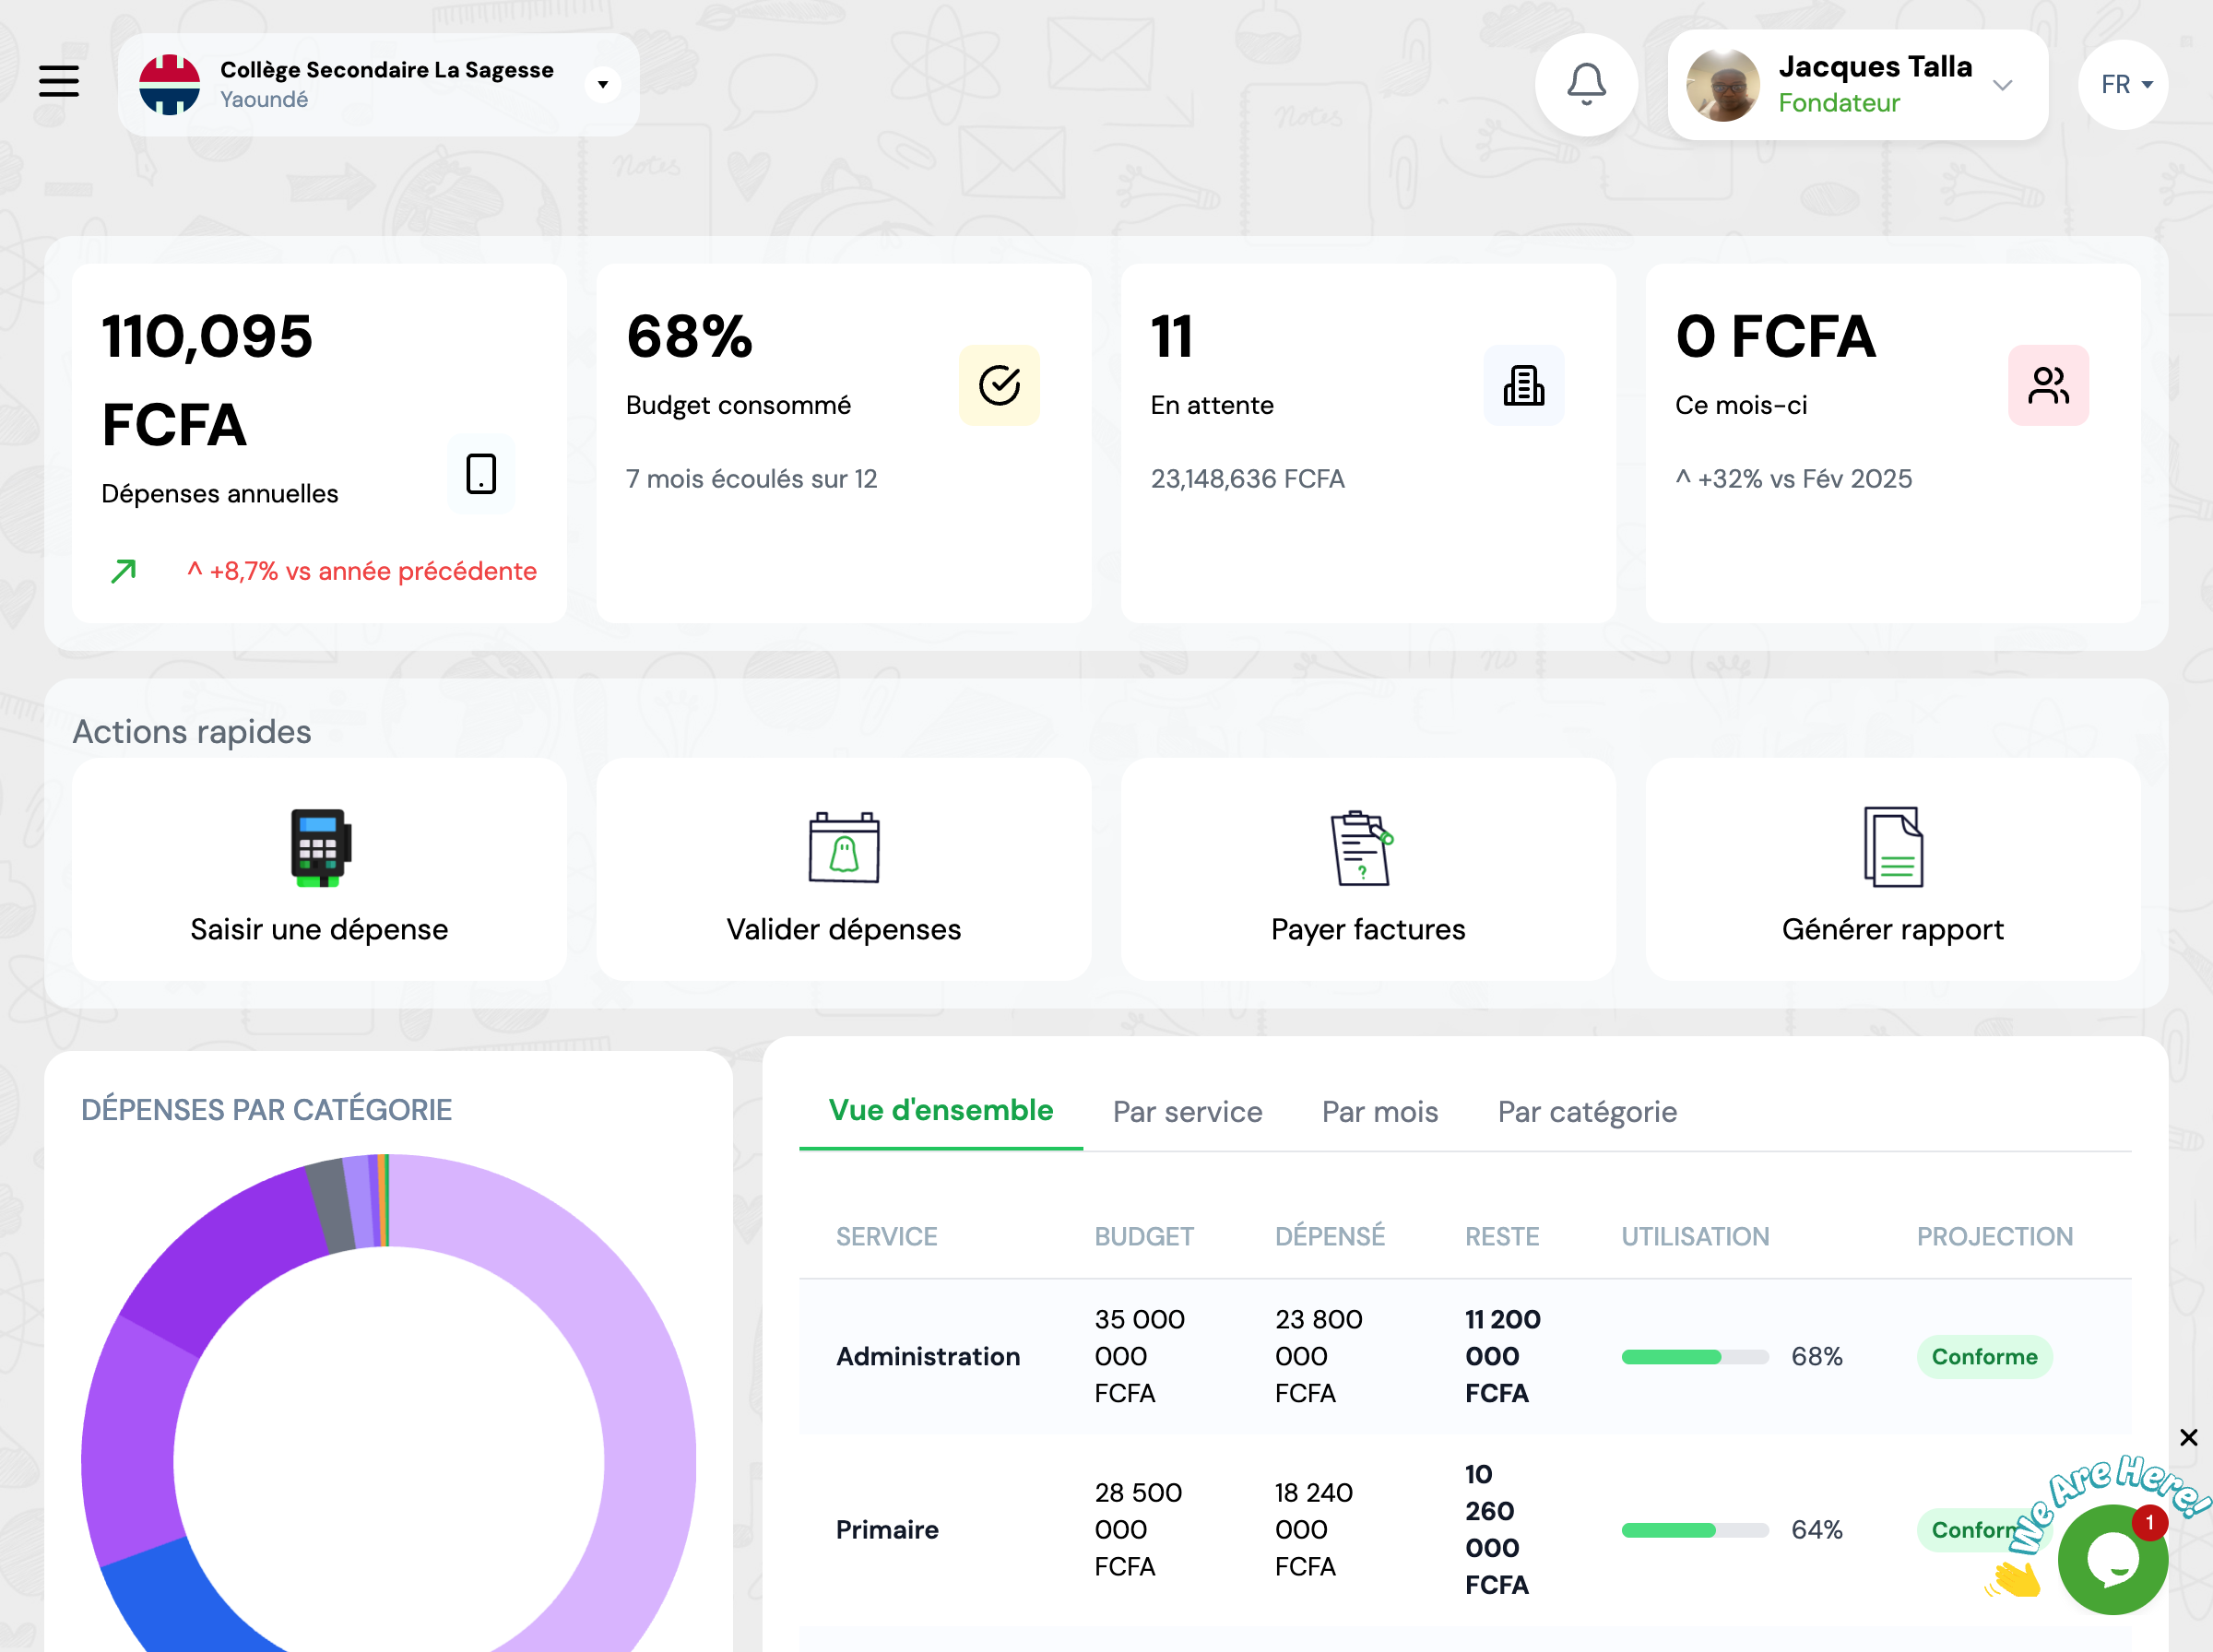
The dashboard presents several key sections that give you an instant snapshot of the financial situation.
Key Metrics
Indicator cards display essential metrics to track your expenses.
Annual Expenses
Total amount of expenses for the current academic year
Budget Consumed
Percentage of annual budget already used
Pending Validations
Number of expenses pending validation and their total amount
Monthly Expenses
Total amount of expenses for the current month
Charts and Analysis
Charts allow you to visualize the distribution of your expenses.
Expenses by Category
Distribution of expenses by type (supplies, equipment, services, etc.)
Distribution by Payment Method
Analysis of payment methods used (cash, check, transfer, etc.)
Budget Progress
Detailed table of budget consumption by department.
Priority Validations
List of urgent expenses pending validation.
Next Steps
Now that you know the dashboard, here's what you can do: