Procurement Dashboard
Monitor your procurement activities with real-time statistics, alerts, and key performance indicators
Table of Contents
1 Introduction to the dashboard
The procurement dashboard is your centralized cockpit to manage all stock and supply management. It offers a real-time overview of your orders, deliveries, invoices, and stock levels.
2 Dashboard features
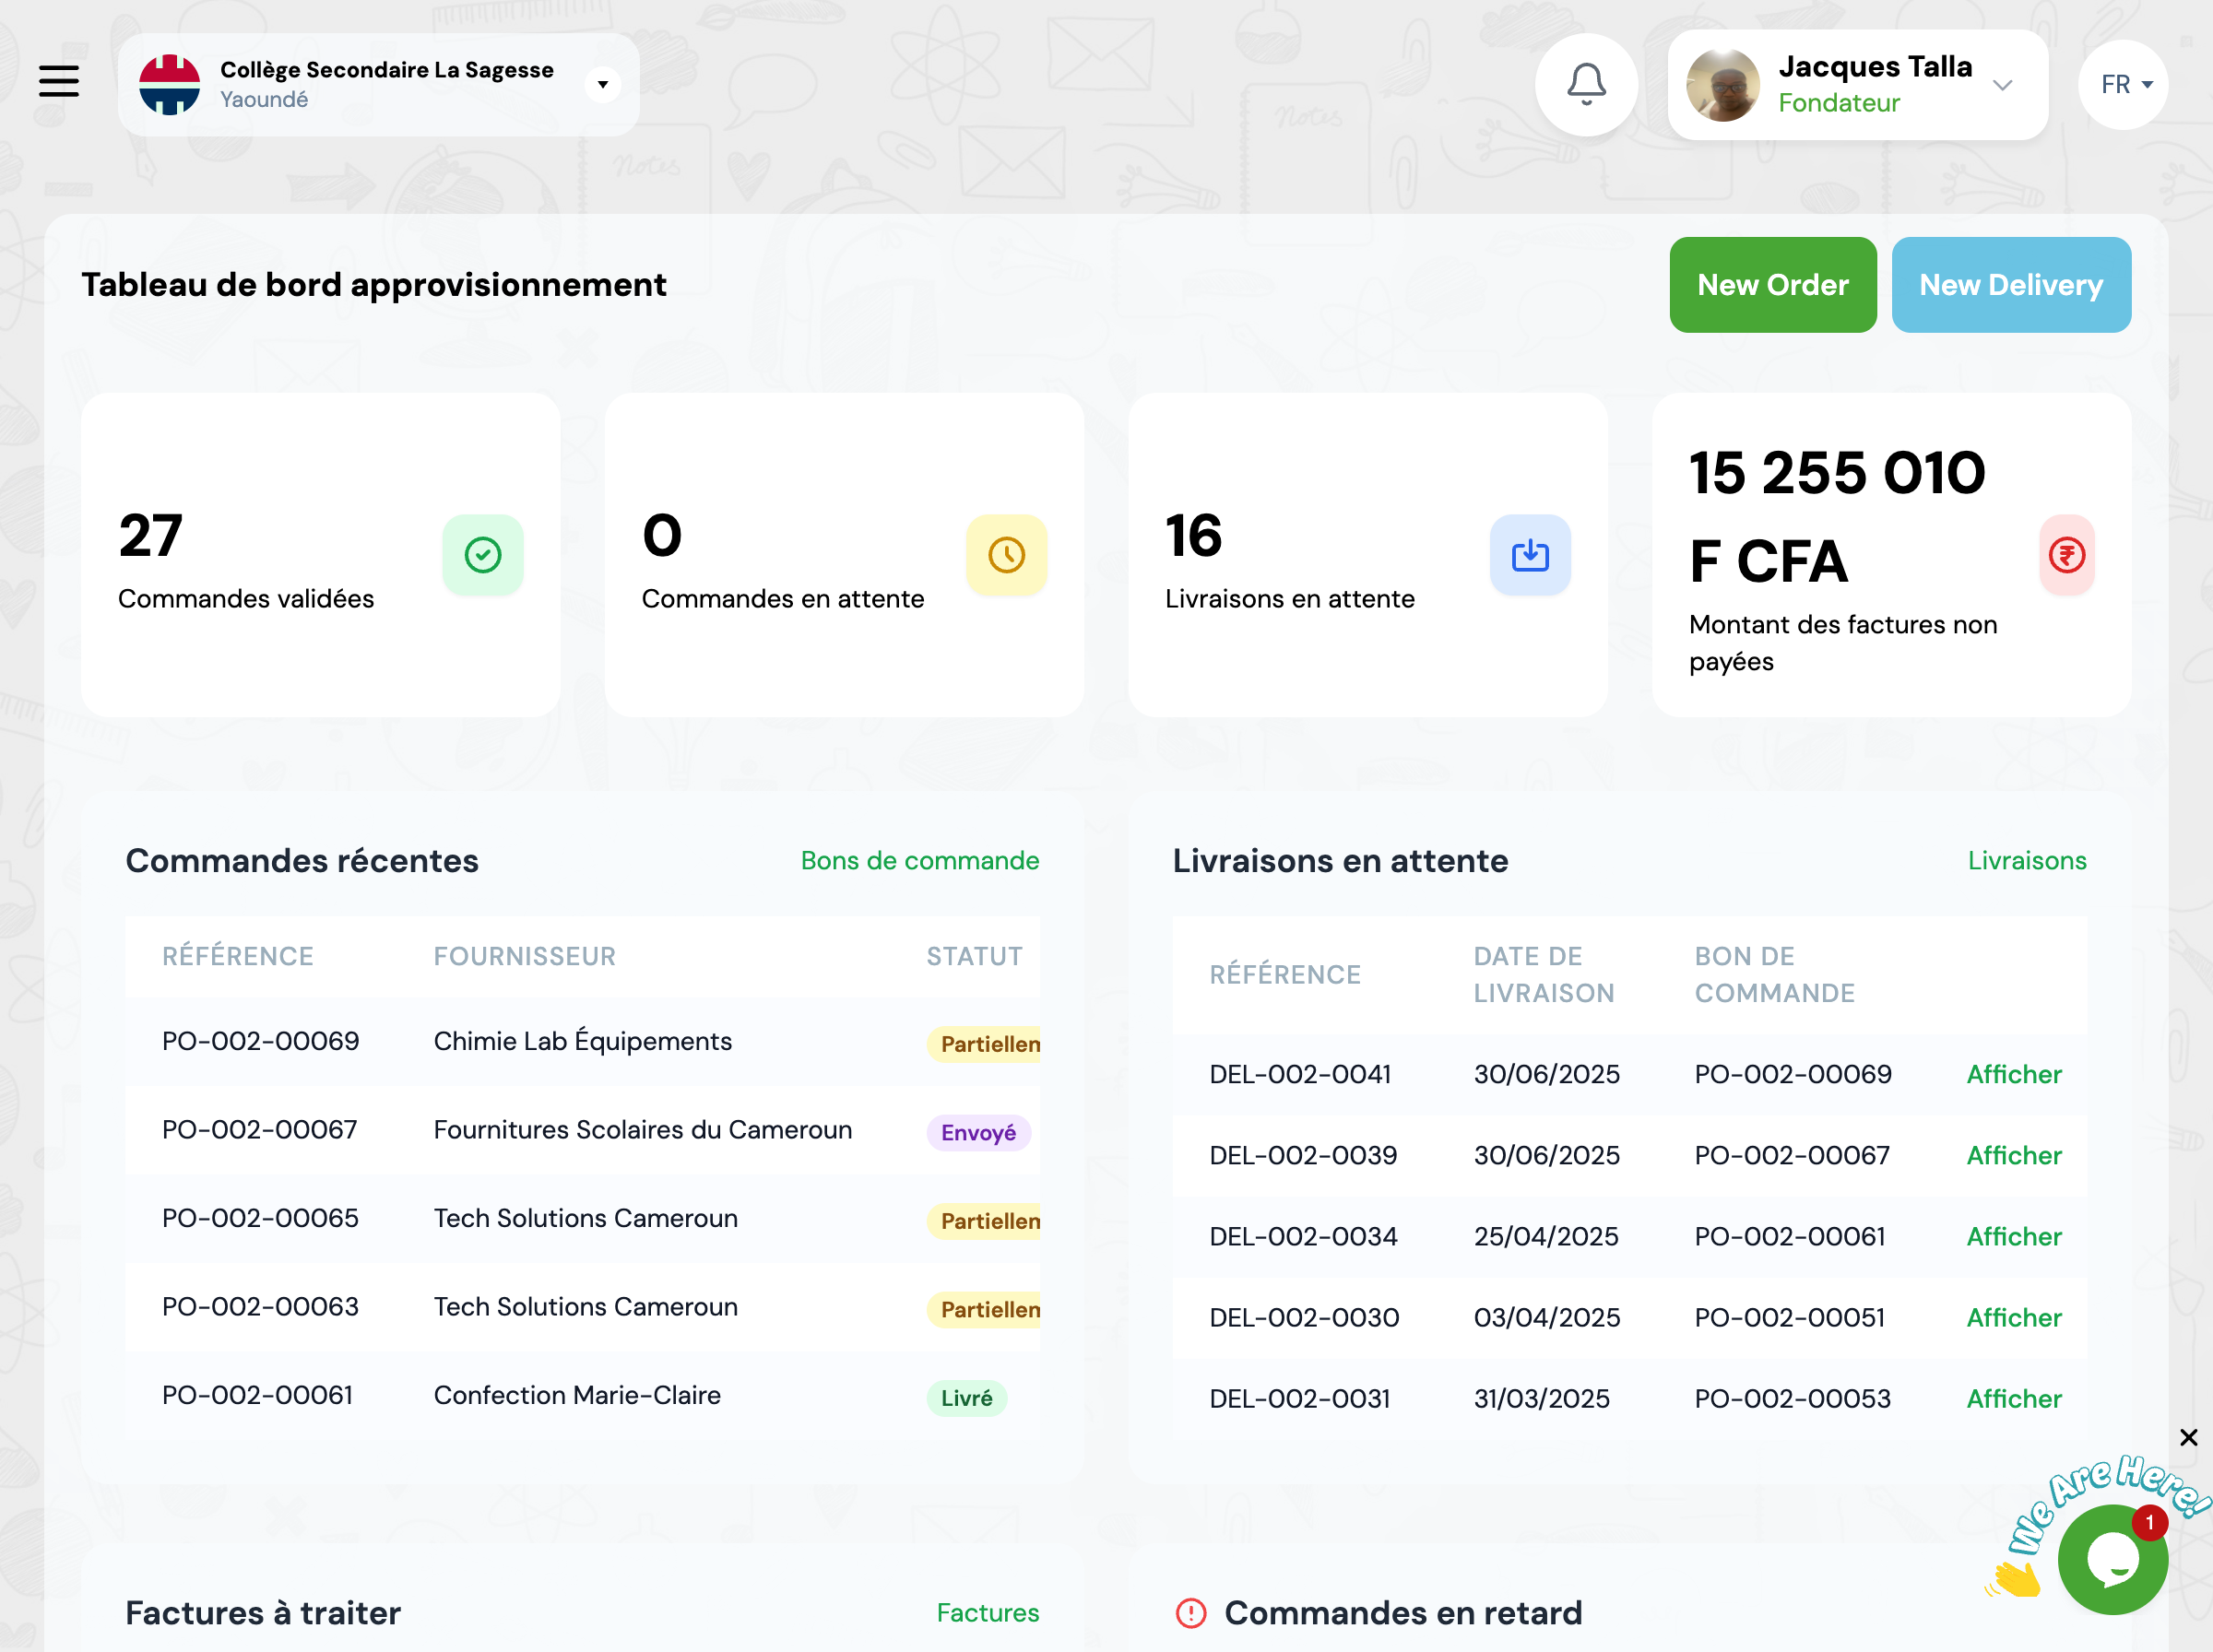
General statistics
Overview of key performance indicators
Total stock value
Value in XAF of your entire inventory
Number of items
Distinct items in your catalog
Low stock alerts
Items below minimum threshold
Orders in progress
Purchase orders awaiting delivery
Pending invoices
Invoices to verify or approve
Recent orders
List of last 10 purchase orders created with their current status and amount
💡 Actions rapides : Quick actions available: View, Receive delivery, Cancel
Pending deliveries
Confirmed orders not yet received
📅 Date prévue : Expected delivery date displayed for each order
🔔 Action : Click 'Receive' to process a delivery
Invoices to process
Invoices awaiting verification, approval, or payment
🔄 Workflow : Workflow: Created → Verified → Approved → Paid
Late orders
Orders whose expected delivery date has passed
⚠️ Alerte : These orders require immediate follow-up with supplier
Number of days late is displayed in red
Low stock alerts
Items whose quantity is less than or equal to defined minimum stock
📦 Recommandation : Quickly create a purchase order to replenish
Current quantity / Minimum stock displayed for each item
3 Using filters
Filter by location
You can filter all dashboard data by specific location
🔍 Utilisation : Select a location in the dropdown at top of dashboard
💡 Effet : Statistics, alerts, and lists will be limited to this location
4 Best practices
Check dashboard daily
Take 5 minutes each morning to check alerts, late orders, and pending invoices.
Immediately handle low stock alerts
As soon as an item falls below minimum stock, create a purchase order to avoid stockout.
Track late orders
Contact suppliers for each late order to get new delivery date.
Quickly validate invoices
Don't let invoices accumulate. Verify and approve them upon receipt to facilitate accounting work.
Use location filters
If you manage multiple locations, regularly filter by location for precise tracking.
Analyze trends
Compare statistics week to week to detect abnormal variations.
5 Frequently asked questions
How often is data updated?
The dashboard displays real-time data. Each time you create an order, receive a delivery, or create an invoice, statistics are immediately updated. Refresh the page to see latest data.
How do I set low stock alert thresholds?
Alert thresholds are defined item by item during item creation or modification. Access the item record and fill in the 'Minimum stock' field. As soon as quantity falls below, the item appears in dashboard alerts.
Can I export dashboard data?
Currently, the dashboard is only viewable online. For exportable detailed reports, use the GO4SCOUNT module or create custom reports in each section (Orders, Invoices, etc.).
How is total stock value calculated?
Total value is automatically calculated by multiplying the stock quantity of each item by its weighted average cost (WAC), then adding all values. This value is updated with each stock movement.
What if I don't see my data?
Verify that: 1) You have necessary permissions to access dashboard, 2) You've selected the correct school in institution selector, 3) You haven't applied too restrictive filter (e.g., empty location).