Fees Dashboard
Overview of revenue and financial statistics for optimal financial tracking.
Introduction
The fees dashboard provides a centralized view of all the institution's financial activities. It allows managers to quickly see revenue, pending payments, recovery rate, and overall financial status.
Good to know
The dashboard updates in real-time and displays data for the current academic year. Statistics can be filtered by period, cycle, or class.
Overview
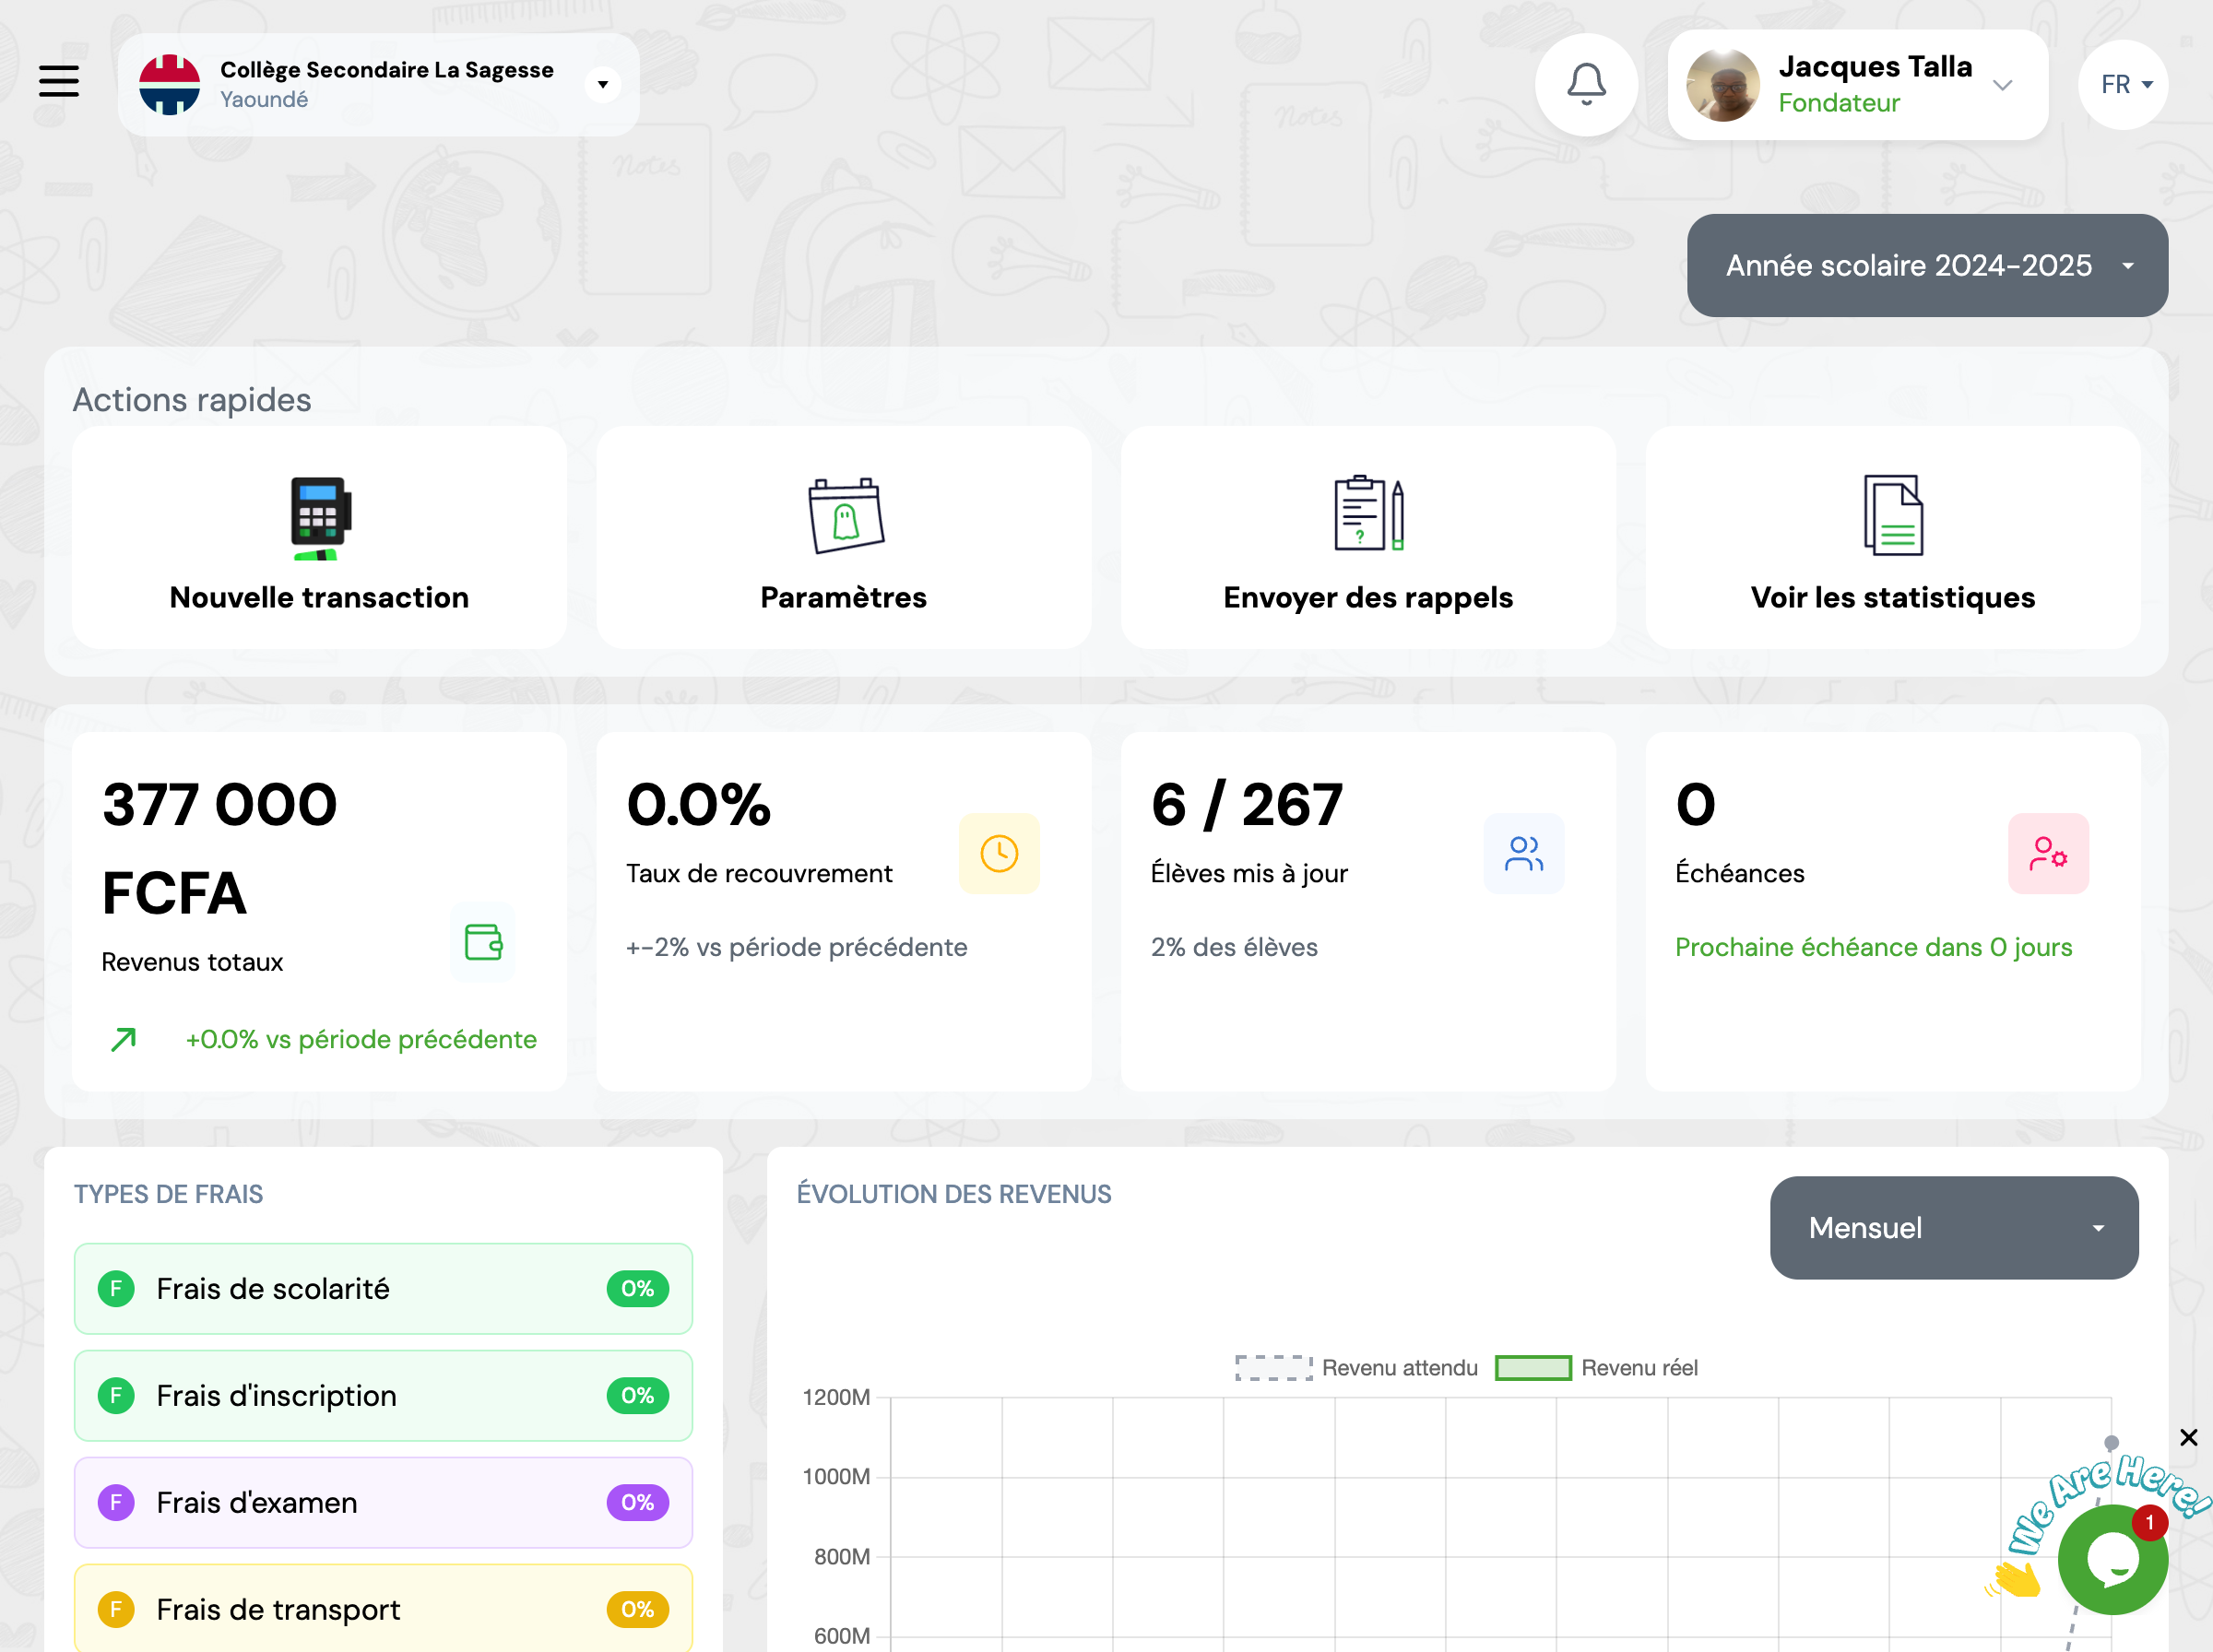
The dashboard presents several key sections that give you an instant overview of your institution's financial situation.
Key Metrics
Total Revenue
Total amount of revenue collected for the selected period
Recovery Rate
Percentage of fees collected versus expected fees
Students Up to Date
Number of students who have paid all their fees
Metric cards display essential metrics for tracking the institution's financial health.
Charts and Statistics
The dashboard offers several visualizations to analyze financial evolution.
Revenue Evolution
Line chart showing revenue evolution over recent months
Distribution by Payment Method
Distribution of payments by method (Cash, Mobile Money, Transfer, etc.)
Quick Actions
The dashboard provides shortcuts to the most frequent actions.
New Transaction
Record a new payment manually
View All Transactions
Access the complete list of transactions
Frequently Asked Questions
How often is the dashboard updated?
The dashboard updates in real-time. Each time a new transaction is recorded or validated, the metrics and statistics are automatically recalculated and displayed instantly.
Can I export dashboard data?
Yes, you can export dashboard data to Excel or PDF format. Use the export button located at the top right of the dashboard to generate a detailed report of all metrics and statistics.
Why don't I see data for all students?
The dashboard only displays data for the current academic year by default. Make sure you have selected the correct academic year in the filters at the top of the page. Also verify that students are properly enrolled for the current year.
How is the recovery rate calculated?
The recovery rate is calculated by dividing the total amount of payments received by the total amount of expected fees for all enrolled students, then multiplying by 100 to get a percentage. Formula: (Total Paid / Total Expected) × 100.
Can I filter data by academic year?
Yes, you can filter all dashboard data by academic year, cycle, or specific class. Use the filter dropdowns at the top of the page to customize the view and focus on specific segments of your student population.